How to Better Find Standard Deviation in Excel for Accurate Data Analysis in 2025
In the realm of data analysis, understanding how to find the standard deviation in Excel is crucial for gaining insights into data variability and ensuring accurate statistical evaluations. This article will elucidate the excel functions for standard deviation, offer practical examples, and share tips to effectively utilize these functions within the Excel environment. We’ll explore how to calculate standard deviation in various scenarios to enhance your data handling in Excel.
Understanding the Standard Deviation in Excel
The standard deviation is a statistical measure that quantifies the amount of variation or dispersion in a set of values. Calculating the standard deviation in Excel helps you assess how spread out your data is, which is critical for making data-driven decisions. Excel provides several functions to compute standard deviation, namely, STDEV.S for a sample and STDEV.P for the entire population. Understanding the difference between these functions is vital, as it dictates the accuracy of your calculations.
Using the Excel Standard Deviation Formula
To get started with calculating standard deviation, you employ the Excel standard deviation formula. For example, if you have a dataset in cells A1 through A10, the formula to calculate the sample standard deviation would be =STDEV.S(A1:A10). Conversely, if you were working with a population, you would use =STDEV.P(A1:A10). These straightforward formulas allow you to analyze data efficiently without complicating the process.
Practical Application of Excel Functions for Standard Deviation
When analyzing large datasets, utilizing the proper excel functions for standard deviation can save time and ensure accuracy. After inputting your data into your Excel spreadsheet, use the STDEV function suited to your needs. Let’s explore a case study: consider a sales dataset where you need to determine the variability of sales figures. By applying =STDEV.S(B1:B20), you easily compute how much sales values deviate from the average. This insight informs strategies for budget forecasting and resource allocation.
Step-by-Step Guide to Calculate Standard Deviation in Excel
Following a systematic approach to compute standard deviation ensures clarity and accuracy. Here’s a structured guide to facilitate your calculations.
Step 1: Organizing Your Data
Begin by organizing your dataset within the Excel spreadsheet. Ensure your data is clean and free from errors, as any inaccuracies can lead to misleading results. Proper data formatting makes it easier to implement statistical analysis functions. Use headers to identify your data clearly, and format numerical figures appropriately.
Step 2: Selecting the Appropriate Function
Next, you need to choose between the various Excel standard deviation formulas. For sample data, leverage =STDEV.S(), and for population data, use =STDEV.P(). If the data underscores more than a simple analysis—operating in a more advanced statistical territory, consider using STDEVP() for a wider insight. Each function caters to different types of statistical analysis.
Step 3: Implementing the Formula
Now, it’s time to enter the formula into your spreadsheet. Click on the cell where you want your result displayed, type your formula with the specified data range, and hit enter. For instance, inputting =STDEV.S(A2:A50) in a new cell will compute the standard deviation of the corresponding dataset. You can utilize the autofill handle feature to apply the function to adjacent cells for batch calculations.
Using Excel Analysis Tools for Standard Deviation
Excel offers a suite of analysis tools that can simplify your statistical operations. Knowing how to leverage these tools can enhance your overall data analysis experience.
Data Analysis Toolpak
One of the most powerful features in Excel for conducting statistical analysis is the Data Analysis ToolPak. To access this tool, go to File > Options > Add-ins, and enable the ToolPak if it is not already activated. Once enabled, you can execute various statistical tests, including standard deviation calculations, by selecting Data Analysis from the Data tab, then choosing Descriptive Statistics to include measures you need.
Graphical Representation of Standard Deviation
Visual aids can greatly enhance understanding; thus, employing charts to represent your data and its standard deviation can reveal significant insights. For example, using line graphs to illustrate averages along with error bars showcasing standard deviation visually communicates variability in data. To add error bars, select your chart, then navigate to the Chart Tools > Layout tab, and add the appropriate standard deviation as an error amount.
Interpreting Results of Standard Deviation in Excel
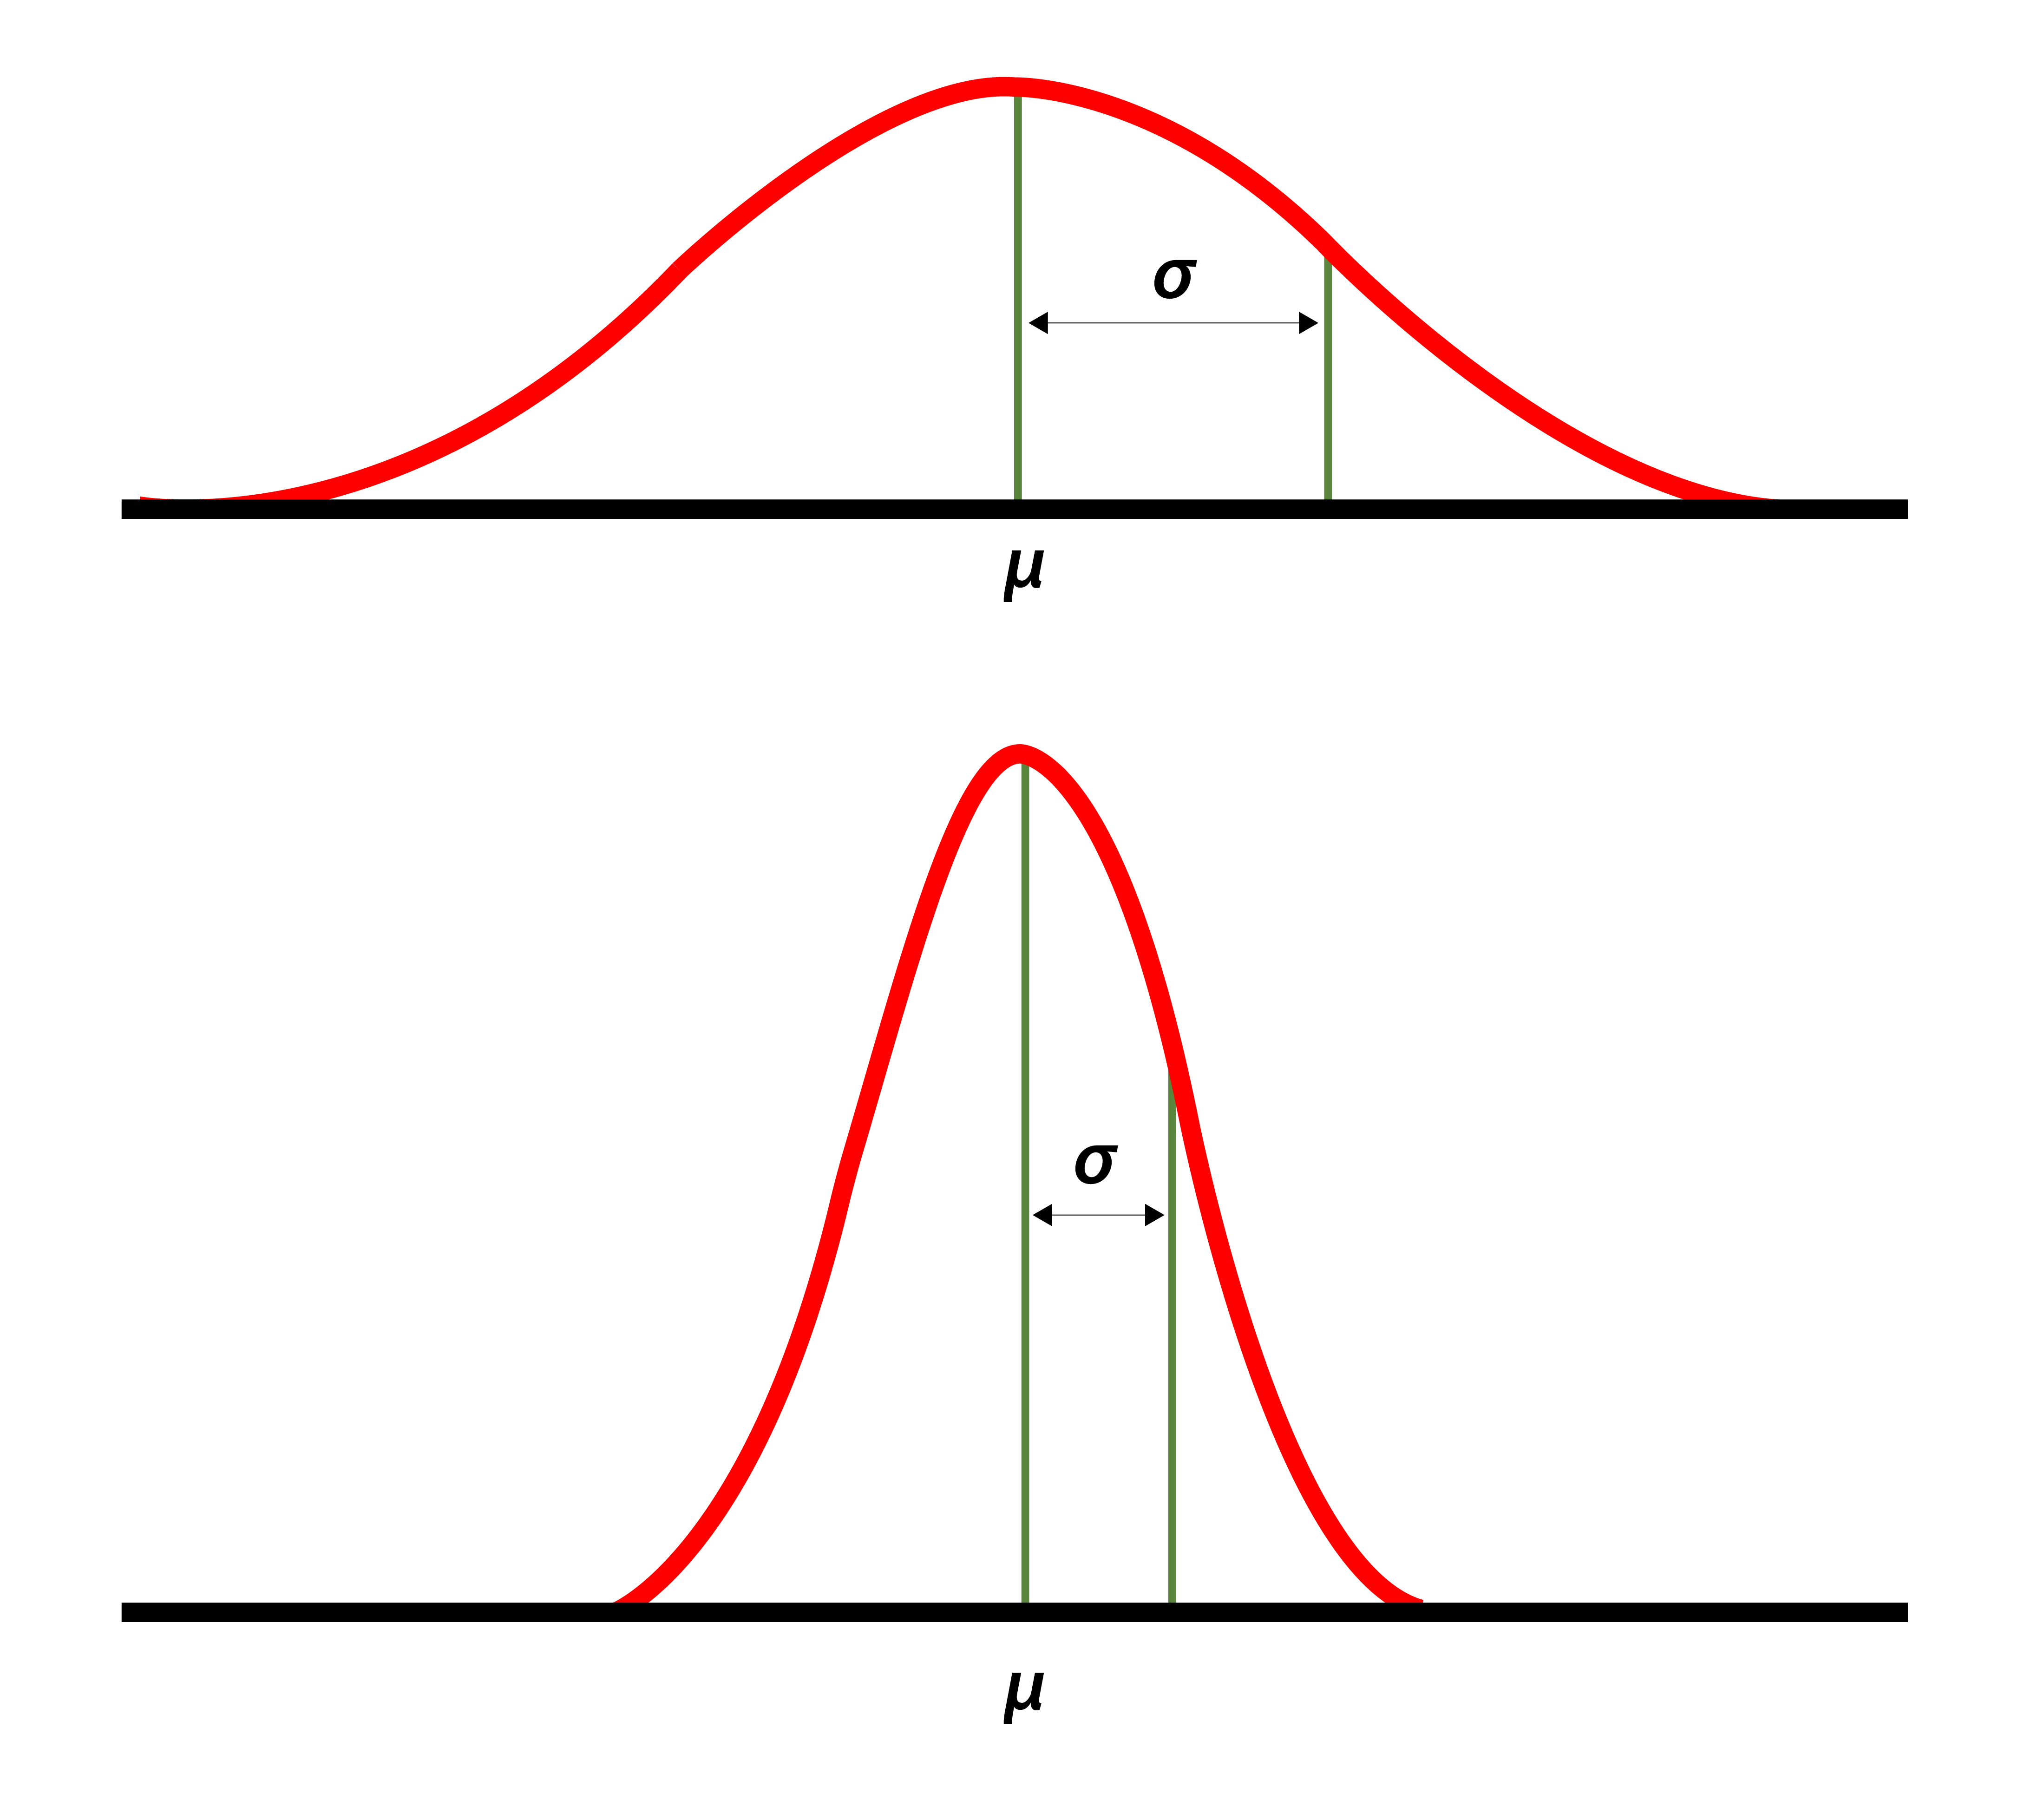
After obtaining your calculations, interpreting those results is critical in Excel data analysis. Understand what the computed standard deviation indicates concerning your dataset. A low standard deviation suggests data points are clustered closely around the mean, while a high standard deviation indicates greater spread out from the average, which could affect decision-making scenarios for business or research.
Key Takeaways
- Understanding how to use Excel for standard deviation is vital to accurate data analysis.
- Utilize different Excel standard deviation functions based on your data type (sample vs. population).
- Organize your data meticulously for precise calculations.
- Employ graphical tools to enhance the interpretability of standard deviation results.
- Continuously evaluate and interpret your data to make informed decisions.
FAQ
1. What is the difference between STDEV.S and STDEV.P in Excel?
The primary distinction lies in their application: STDEV.S calculates standard deviation based on a sample of a population, while STDEV.P computes the standard deviation for the entire population. Choosing the correct function ensures you appropriately analyze your data, as using one instead of the other can lead to inaccurate interpretations.
2. How can I visualize the standard deviation of my data in Excel?
You can effectively visualize standard deviation using charts, such as line graphs or bar charts, with error bars that represent standard deviation variations. This allows for a clearer understanding of data dispersion and helps convey important statistical information effectively to your audience.
3. Are there other statistical functions in Excel related to standard deviation?
Yes, Excel includes numerous functions related to statistical analysis, such as variance (using VAR.S for sample variance and VAR.P for population variance), which is intrinsically connected to standard deviation since standard deviation is the square root of variance.
4. Can I automate standard deviation calculations in Excel?
Yes! By creating a simple macro or using Excel’s built-in functions, you can automate standard deviation calculations for repetitive tasks. This not only saves time but also minimizes potential errors that can occur with manual calculations.
5. How can I find the standard deviation for multiple datasets in a single formula?
Utilizing array formulas, you can analyze multiple datasets simultaneously. For instance, you can calculate multiple standard deviation values in a single operation using =STDEV.S(A1:A10, C1:C10), allowing for comprehensive analysis across datasets within just before running the formula.