Smart Ways to Find Asymptotes in 2025: Achieve Accurate Graphing Success
Understanding how to find asymptotes is essential for success in graphing complex functions. Asymptotes are integral to the behavior of a function, describing how they approach certain lines or curves at extreme values of the variable. In this article, we will explore effective techniques for finding asymptotes, looking at various types, including vertical, horizontal, and slant asymptotes. With proper methods and practical examples, mastering asymptotes in graphs can become a straightforward process. Let’s delve into definitions and practical strategies to enhance your graphing skills in 2025.
Understanding the Asymptote Definition
To begin, let’s clarify the asymptote definition. An asymptote is a line that a graphed function approaches but never touches as it extends towards infinity. There are three major types: vertical asymptotes, which arise from values where the function becomes undefined; horizontal asymptotes, indicating the value a function approaches as the variable tends towards infinity; and slant asymptotes, which occur when a function’s degree in the numerator is one greater than that of the denominator. By thoroughly grasping these definitions, your understanding of determining asymptotes can significantly improve.
Characteristics of Asymptotes
Understanding the characteristics of asymptotes involves recognizing the unique behaviors of different types. For instance, a vertical asymptote is identified by values that make the function undefined, typically present in rational functions. Conversely, a horizontal asymptote can often be identified by the limits of functions approaching infinity. A slant asymptote typically represents a linear approximation of the function’s behavior as x approaches infinity, arising specifically when dividing polynomials. Including these considerations leads you to better analyzing asymptotes and predicting the behavior of functions.
Asymptotic Behavior in Graphical Representation
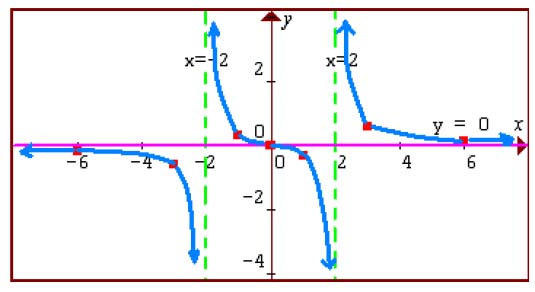
The concept of asymptotic behavior is significant when sketching functions. As you graph a function, be mindful of how it behaves as it approaches its asymptotes. For instance, when nearing a vertical asymptote, the graph will tend to rise or fall towards infinity. In contrast, a horizontal asymptote reflects a leveling off as the graph stabilizes at a particular value. Mastering the concept of limits and asymptotes requires practice, resulting in increased accuracy when graphing asymptotes.
Techniques for Finding Asymptotes
When it comes to finding asymptotes, employing various techniques can simplify the process and assist learners in mapping out functions accurately. The primary strategies include utilizing algebraic methods to derive asymptotes and graphical tools that provide visual guidance in understanding function behaviors.
Algebraic Methods for Finding Asymptotes
Employing algebraic asymptotes involves manipulating the function’s equation to uncover asymptotes directly. To find vertical asymptotes, solve the denominator for zero, leading to undefined points in the function. For horizontal asymptotes, analyze the function’s behavior as x approaches infinity. If the degrees of the numerator and denominator are equal, the horizontal asymptote equals the ratio of their leading coefficients. Thus, you will derive equations of asymptotes effectively through careful consideration and calculation.
Graphical Methods for Asymptotes
Complementing algebraic techniques with graphical methods for asymptotes can provide an intuitive feel for function behavior. Graphing tools available both digitally and in textbooks often show vertical and horizontal asymptotes visually. These tools help mentor students in visually understanding concepts and obtaining accurate asymptote calculations. Moreover, seeing the overall curve of a graph can help predict the sectioning of graphs with multiple asymptotes more comprehensively.
Common Mistakes in Finding Asymptotes
Throughout their studies, students may face several common mistakes when attempting to find asymptotes in functions. It’s crucial to recognize these pitfalls and learn how to avoid them.
Confusing Vertical and Horizontal Asymptotes
One prevalent mistake is confusing vertical asymptotes with horizontal asymptotes. Vertical asymptotes indicate where a function approaches infinity or becomes undefined, while horizontal asymptotes specify the behavior of the graph as it goes toward infinity horizontally. Understanding this distinction fully will enhance your skill set in identifying asymptotes and can help you avoid misunderstandings in the future.
Neglecting Limits in Asymptote Problems
Many students overlook the importance of understanding limits in asymptote problems. Mastery over limits and asymptotes is critical, particularly when evaluating function behavior at infinity or at discontinuities. To accurately identify asymptotes in graphs, it is essential to incorporate limits into your analysis whenever necessary. Analyzing the limit approaching asymptotes allows for clearer recognition and enhances overall graph transformations.
Key Takeaways
- Understanding the different types of asymptotes and their corresponding definitions is vital for accurately grappling with functions.
- Utilizing both algebraic and graphical methods strengthen identification techniques for finding asymptotes.
- Awareness of common mistakes can foster a more intuitive approach to asymptote analysis and streamline learning.
- Regular practice with varied asymptote examples assists in better understanding and mastery of these essential concepts.
FAQ
1. What is a vertical asymptote?
A vertical asymptote occurs at values of x where the function becomes undefined. As the function approaches this value, it tends to infinity in either the positive or negative direction. Identifying these points involves setting the denominator of rational functions to zero and solving for x.
2. How do you find horizontal asymptotes?
To locate horizontal asymptotes, consider the degrees of the polynomials in the numerator and denominator. If the degree of the numerator is less than that of the denominator, the horizontal asymptote is y=0. If they are equal, the horizontal asymptote is the ratio of their leading coefficients.
3. What is a slant asymptote?
A slant asymptote forms when a rational function’s degree is higher in the numerator than in the denominator. It can be found using polynomial long division, providing a linear representation of the function as it extends towards infinity.
4. Why is understanding asymptotes important?
Understanding asymptotes is critical because they represent the behavior of functions as they approach certain points or infinity, helping predict trends in graph behavior and ensuring accurate graph representations in calculus and advanced mathematics.
5. How can I improve my skills in identifying asymptotes?
Improving skills in identifying asymptotes can be achieved through consistent practice with asymptote examples, utilization of graphing tools, and understanding the principles of limits and function behaviors in calculus. Engaging with sample problems and teaching methods can also help solidify these concepts.
By mastering these concepts and techniques, you’ll enhance your graphing skills in 2025 and beyond. Happy graphing!