Essential Guide to How to Find Confidence Interval
Understanding Confidence Intervals in Statistical Analysis
Confidence intervals are a fundamental concept in **statistical analysis**, providing a range of values that estimates a population parameter based on sample data. This method allows researchers to gauge the **variability** within their data and understand the degree of uncertainty linked to their estimates. Essentially, a **confidence interval** offers a way to express the **margin of error** around a sample mean, indicating how sure we are that our estimate holds true for the greater population. A well-calculated confidence interval enhances **data interpretation** by quantifying the potential discrepancy between the sample and population results, benefiting fields ranging from healthcare to finance and political polling.
The Importance of Confidence Levels
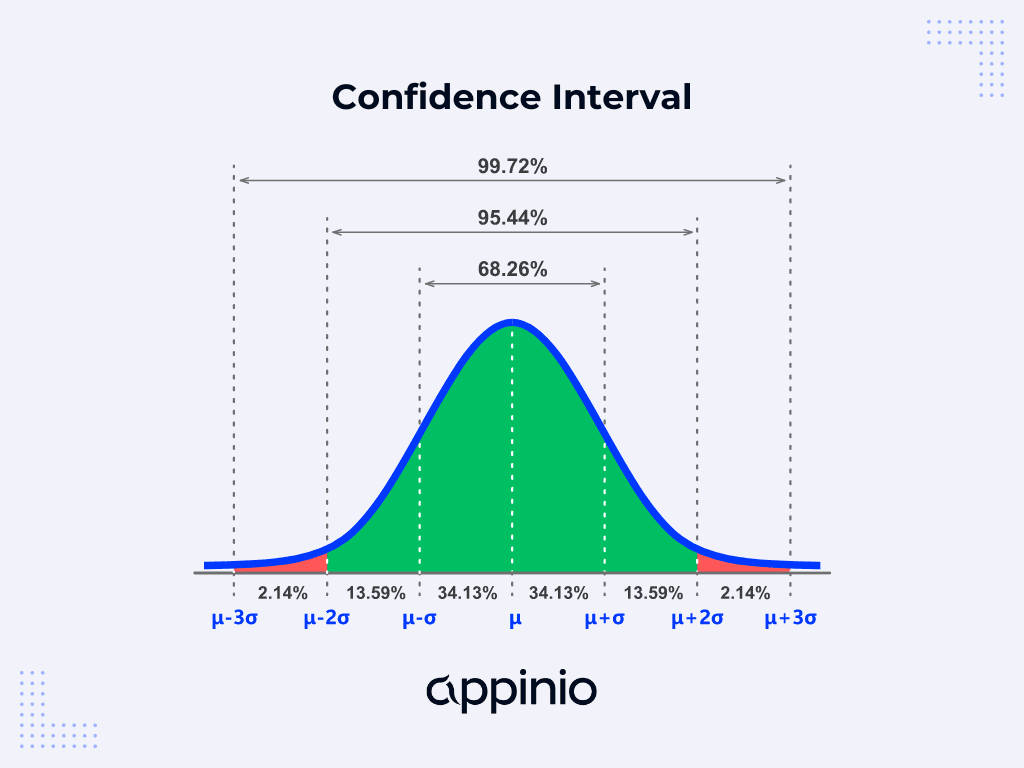
The confidence level, typically expressed as a percentage (like 95% or 99%), represents the likelihood that the interval estimate will contain the true population parameter. A higher confidence level results in a wider **confidence interval**, reflecting our increased desire for certainty. For instance, a 95% confidence level implies that if we were to take numerous samples from the same population and calculate confidence intervals for each sample, approximately 95% of those intervals would contain the actual population mean. This concept is grounded in the **central limit theorem**, which assures us that, under certain conditions, sampling distributions tend to be normally distributed as sample sizes increase.
Calculating the Margin of Error
The **margin of error** is a critical component in determining the **confidence interval**. It indicates the range of uncertainty surrounding the sample estimate. To calculate the margin of error, one must know the standard deviation, often represented as sigma (σ), and the standard error, which is derived from the sample size (n). The formula typically used is the following: margin of error = critical value x standard error. Depending on whether you’re using a **z-score** or a **t-score**, depending on whether your sample size is large or small, the calculations may vary. In practical applications, knowing how to compute this margin is essential for ensuring that your **estimation methods** remain accurate and reflective of the actual data variability.
Applying Confidence Intervals in Research
Applications for **confidence intervals** span multiple domains, facilitate informed decision-making rooted in data analysis. In fields such as **clinical trials** or **survey analysis**, they help determine where a true result lies. These intervals shed light on the potential effects of treatments and interventions by estimating population parameters, driven by the computations carried out on sample results. For instance, if researchers find a 95% confidence interval indicating that a new drug’s effectiveness lies between 45% and 55%, they can conclude with statistical validity that the drug has a substantial effectiveness rate. Therefore, learning how to use them effectively sharpens overall research methodology and enhances the reliability of results.
Components of a Confidence Interval Calculation
To compute a confidence interval accurately, several components need to come together. Key factors such as the **sample mean**, **standard deviation**, and the critical value all play crucial roles. Understanding each element is vital to performing valid calculations. Leverage the **confidence interval formula** tailored to your specific needs, knowing whether you are evaluating means or proportions—each has distinct formulas aligned with their respective statistical contexts. Familiarize yourself with these tools to ensure precision in your estimates.
Elements of the Confidence Interval Formula
The general formula for a confidence interval around a sample mean is: CI = sample mean ± (critical value × standard deviation/√n), where CI denotes the confidence interval, n is the sample size, and the critical value derived from **z-scores** or **t-scores** corresponds to your desired confidence level. For means corresponding to a normal distribution, a z-score is used. Conversely, when the population standard deviation is unknown and dealing with small sample sizes or high variability, a t-score is apt. As an example, when dealing with a sample mean of 100, a standard deviation of 15, a critical z-value of 1.96 for a 95% confidence level, and a sample size of 30, the confidence interval is calculated and would provide clear insights.
Interpreting Confidence Interval Results
After calculating a confidence interval, accurately interpreting the results is pivotal. For instance, if your CI winds up being between 88 and 112 for a sample mean, it indicates a strong probability that the true population parameter lies within this range. Pay attention to the **width of the confidence interval**, which signifies the level of precision in your estimates; narrower intervals suggest higher precision while broader intervals indicate greater uncertainty. Identifying these aspects helps researchers, analysts, and decision-makers understand how to translate statistical findings into actionable insights.
Common Pitfalls in Confidence Interval Calculations
When conducting statistical analysis and calculating **confidence intervals**, there are several pitfalls that one should avoid. Misunderstanding the foundational concepts of **statistical significance** can lead to probable inaccuracies in conclusions. Equally, a failure to adequately increase sample size when variability increases or leveraging incorrect formulas can skew results significantly. It is advisable to remain cautious about the assumptions underlying your analysis—especially in cases of **non-normal distribution** or smaller sample sizes.
Recognizing Non-Normal Distributions
Not all data adheres to a normal distribution; some may exhibit traits of skewness or kurtosis. In instances like these, practitioners need to turn to **non-parametric confidence intervals** or utilize methods that account for data variability adequately. **Bootstrapping** is one such resampling technique that allows for the development of confidence intervals without requiring a normal distribution. This flexibility is crucial in maintaining the integrity and reliability of the analysis, particularly within fields characterized by complex data sets, like finance and social sciences.
Maintaining Statistical Rigor and Reliability
To uphold statistical rigor when calculating confidence intervals, always apply sound methodology and uphold quality standards for your **data collection** process. Consider systematically sampling methods to avoid bias, ensuring your data reflects the population accurately. Additionally, reliability techniques or checks on your predictive analysis can help illuminate errors and enhance result credibility. By adhering to these practices, statistical power is upheld, enhancing the robustness of the analyzed outcomes.
Key Takeaways
- Confidence intervals provide a range of estimated values for population parameters, enhancing statistical analysis and data reliability.
- The confidence level and margin of error are pivotal to computing confidence intervals, directly impacting their interpretability.
- Miscalculation or misinterpretation can lead to unfounded conclusions; thus, rigor in methodology is integral for accurate results.
- Advanced techniques such as bootstrapping can deal with data irregularities, maintaining confidence in the analysis.
FAQ
1. What is a confidence interval formula?
The confidence interval formula varies depending on whether you are estimating a mean or proportion. For means, it is typically written as: CI = sample mean ± (critical value × standard deviation/√n). For proportions, it would change accordingly based on the sample proportion and its distribution characteristics.
2. How do I calculate confidence intervals for proportions?
To calculate a confidence interval for proportions, the formula used is: CI = p̂ ± z × √(p̂(1 – p̂)/n), where p̂ is the sample proportion, z is the z-score corresponding to the desired confidence level, and n is the sample size. This helps estimate population parameters particularly in survey analysis and marketing analytics.
3. Why are confidence intervals wider for larger samples?
Confidence intervals become wider with larger sample sizes primarily due to the increased precision of the estimates derived from larger datasets. The standard error decreases, offering narrower confidence intervals; so when assessing reliability, larger sample sizes enhance the confidence in representing the population accurately.
4. Can confidence intervals applied to non-normal distributions?
Absolutely! When populations do not conform to normal distribution patterns, techniques such as **non-parametric confidence intervals** or bootstrapping are applicable. These methods enable you to derive reliable populations estimates without strict adherence to normality assumptions, accommodating skewed or kurtotic datasets.
5. In what situations might a t-score be preferred instead of a z-score?
A t-score is preferred when the sample size is small (generally n < 30) and the population standard deviation is unknown. Because the t-distribution accounts for extra variability expected in small samples, it is crucial for improving accuracy in statistical inference.
6. How does the central limit theorem relate to confidence intervals?
The central limit theorem states that as the sample size increases, the sampling distribution of the sample mean will approach a normal distribution, regardless of the shape of the population distribution. This theorem underpins the ability to construct confidence intervals using normal distribution assumptions, allowing reliable inferences in even non-normal populations when sufficiently large samples are collected.
7. What role does the critical value play in the confidence interval?
The critical value represents the z-score or t-score that determines the width of the confidence interval associated with a given confidence level. A higher critical value corresponds to a wider confidence interval, providing more assurance that the true population parameter lies within this range, vital for quantitative research and statistical inference.